

Earlier today, Maya the cat (pictured below, foreground) was watching snowflakes out the window. She’s just a cat, so for her, it’s a mild diversion before her next nap. She’s never heard all that oohing and aahing about how every snowflake is unique. Being a marketer, and not a cat, the snowflakes made me think about a report in Google Analytics.

Figure 1: Not planning to log into GA
Last week, I talked about absorbing real-world feedback from a frequent e-commerce shopper.
There are also great ways to get a feel for individual user journeys (sometimes, they truly are a long, long, long, and winding, winding, winding road) by tapping into advanced reporting. One such report, User Explorer, is available in many Google Analytics accounts. I’ll focus today on the delights of this report.
But does it really make (“scientific”) sense to drill down on segments so small that they couldn’t be any smaller if they tried? If you will, the “atom level” of the trials and tribulations of a single user? (Those trials and tribulations must be the subatomic particles, then. I mean… who would ever think anyone would need to know subatomic particles are a thing, uhhh, right?) Aren’t aggregates better?
We’ll always plan and optimize around aggregate data, of course.
But actually, some of the greatest minds in marketing and analytics believe that aggregates are ho-hum. Said minds love drilling down on small – even tiny – segments, as a way of building insight about behavior. Avinash Kaushik has even said that “all data in aggregate is crap“! I’m sure he was just trying to get our attention.
A particular class of myths revolve around troubleshooting “what’s wrong with that page,” or “what is causing them to abandon the cart.” Looking at a few real-world journeys (especially across multiple businesses, if you are a marketer who has access to other client data) should be enough to demonstrate that indecision is normal when it comes to certain types of purchases. The fairly typical pattern of adding to cart without buying isn’t something a seller can easily stamp out. Of course, UX troubleshooting is its own discipline, and valuable. But it’s not a silver bullet. Research behaviors simply cannot be stamped out entirely. Nor should they be. They’re normal. Consumers have budgets and tastes. People comparison shop. Sometimes, they need to get feedback from family. Sometimes, they interact with your business (to ask a question) before they buy, as opposed to merely reading your website content, email, or social posts.
Water, water, every where, nor any drop to drink [sic]
Seas of data are available to marketers, yet conjecture abounds. “We figure if they haven’t bought within a couple of days, they’re not going to.” True?
Let User Explorer answer that one! Here’s an interesting example to get us started.
In Google Analytics, find the User Explorer report under Audience > . (Obviously, this is subject to change and may vary from account to account. Hey, it’s Google Analytics! Your cheese may be moved at any time without notice.) First, consider setting a date range of moderate length or longer (say, 4 months to a year or more), if available.
You’ll see this amazing list of individual users, anonymized with long encoded numbers. If you drill into a single one, you’re going to see every user session for which that user has engaged your website. It’s like a calendar of that “user’s journey.” The default sort order is in order of user sessions. If you prefer, sort by revenue, or something else.
For one of our clients (setting a date range of the last six months of 2019), the “champ” in terms of user sessions was a person who visited the website over 300 times, ultimately resulting in just over $300 in revenue. Usually, anyone at the top of any list like this is an outlier, so you can sort of discard these particularly anomalous patterns, but the pattern in itself makes you truly wonder. The prospective customer visited the site hundreds of times from organic search (most of them likely searches on the client’s brand keywords), and then by November, had begun visiting (again, hundreds of times) from a link or multiple links associated with email campaigns (or possibly internal personal emails from family – let’s assume I’m not bright enough to tell the difference from this report). Sometimes, the cart was loaded up with 10 items without buying. Sometimes all of this activity occurred in the middle of the night. This type of buyer we will refer to as Insomniac/Ditherer.
Interestingly, though, at least for the User Explorer report, the user’s “Acquisition Date” and Acquisition source/medium is assigned to the “first time the user interacted with your content.” That was in September, from the Google Organic Search channel.
Even with all of that agony, $300+ is probably around the average for lifetime value of a customer for this client, and we may be just getting warmed up. Perhaps as trust is gained and routines are formed, this customer will go on to spend $2,000 over a lifetime. I don’t suppose that all that visiting is costing the client anything. No servers are getting worn out. The only damage being done is to the user’s thumbs (and REM sleep). Annoying, perhaps, but also interesting, eh?
To protect client and user privacy, I haven’t drilled deeper into the detail of the user sessions, but see a snapshot below. In that additional detail (not shown) every significant pageview and operation (such as “viewed cart,” visited x page, etc.) is detailed and time-stamped. Back in October, the user checked out customer reviews (the ones published on the site). It’s all in there.
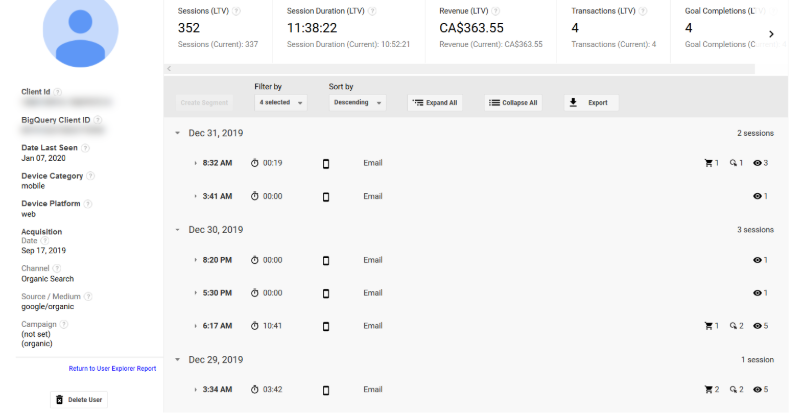
Figure 2: Sleepless in Sarnia. (Sarnia is an example: not real client location.)
(Unfortunately, it appears that device-switching behavior is not generally part of the User Explorer report. The “Client ID” is defined as “a unique ID that Analytics assigns to each device from which users engage your content.” So for this person, imagine their entire family doing similar research on all manner of computers. Their six-month session tally could easily top 1,000!)
Subject #2
But let’s move down the list to the 200th most frequent site visitor for this client in H2 2019. This is an individual who visited the website 34 times between July and October. They spent a healthy $1,135 spread over four transactions. The attribution is divided between “direct” (typing in the web address or perhaps coming in from a bookmark) and PPC advertising (“cpc”). The sad thing about this is we’re going to have a very hard time figuring out how much to credit our different marketing channels. Frequent visits from “Paid Search,” leading to some purchase behavior, may well be from the standard PPC advertising on the client’s main brand, which is similar to a brand organic query in that is purely navigational – returning with high purchase intent.
At another point along the way, the customer spent $180 right after viewing a Display ad. Would it have been a remarketing ad, which serves as a reminder to buy to a person we targeted based on certain audience characteristics (presumably, a previous site visit)? Likely.
About four weeks after buying from the Display ad, this customer spent over $300 (the pattern is familiar: make a test purchase, then expand the relationship once satisfied) from one of the many Paid Search visits subsequent to that. Likely scenario: the product arrived, was high quality, and more needs/wants emerged. On the subsequent “trigger pulling day” in early October, this individual looked at 49 pages on the website and did stuff with the cart more than 30 times, before purchasing 6 items for over $300 in total. The user session was 79 minutes long! The meeting we’ll have to account for all this effort in making a purchase may well last that long as well. ☺ In reality, some purchases involve more blood, sweat and tears than others (say, if they’re customized, or if a whole family is making the decisions). So that’s not as weird as it may sound.
Here’s a snippet of what you’d see in the User Behavior report. I’ve left out some of the more interesting “add to cart” product details to protect user and client privacy.
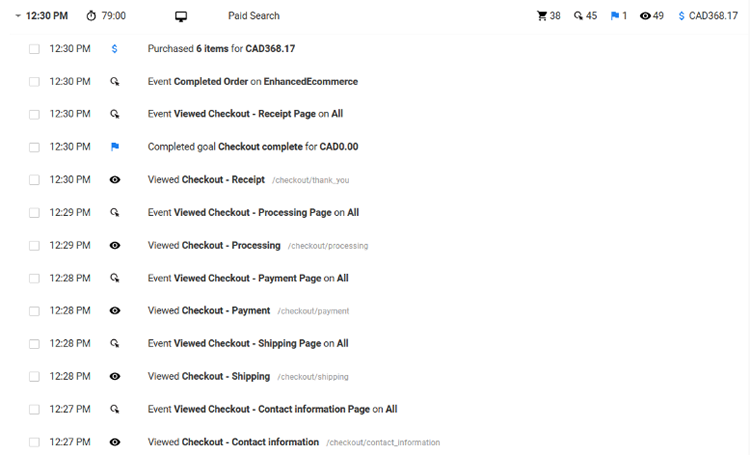
Figure 3: Cha-Ching.
The insight we gain from this report, then, is in stark contrast to what we learn from “story-less” aggregated data. These are epic quests, narratives worthy of Homer. They are real human lives.
Some marketers focus a lot on average order sizes, trying to figure out how to induce consumers to pile more into the cart, or to become more interested in higher-ticket items. Nothing wrong with that, of course. But you quickly learn that this alone isn’t the sole profit-driver. A heavy profit-driver is high-value customers! Also known as “high lifetime value.” In evaluating many businesses for investment, investors often use ratios such as LTV:CAC, or “lifetime value divided by the cost to acquire a customer.”
Studying how a single individual made several large orders over a period of 6-8 months, totaling, let’s say, $2,500, is a great way to hammer this point home. That individual is putting the $100 average order size and typical lifetime value of $160 person to shame. In terms of their enthusiasm for the products, and the profit that represents for the business, they’re running circles around Agatha Aggregate. Such insights can become actionable, of course, but maybe the first win from having this insight available is to cut down on the unproductive hand-wringing about the majority of customers who may not be particularly loyal. Or worrying about why people don’t fall down at your feet instantly after interacting with your ads or content. Apparently, people aren’t just moist robots.
The limit does exist
Also from the User Explorer report, I recently noticed that one of the biggest, fastest purchases of a luxury furniture piece from a friend’s recently-launched business was from an Instagram interaction. Thank you, User Explorer! Even if one could imagine that the Instagram-based acquisition of over $1,000 in revenue was not the sole touchpoint for this customer, it provided concrete evidence – backed by the logic that aspirational purchasers do follow specialty retailers on Instagram – that a little sizzle sells. Engagement (paid and unpaid) on any social channel or YouTube isn’t something to sneeze at. Small businesses are stretched for time and resources, but having a little shred of concrete evidence – like a larger-than-usual purchase from a medium that appeals to aspirational buyers – helps them answer the question “should we keep working this channel?”

Figure 4: From the showroom to the owner’s home… and 210 Instagram likes. Hey, if you’re going to post a shot of your own living room on social, we at SOPPC say fair game to publish it! P.S. The wood table is the best! P.P.S. Cool it on the hashtags!
Being “data-driven” may often require a deeper dive than you might expect – and the User Explorer report can be the “data vs. data” reality check you might need. Seeing lukewarm aggregate results for certain channels should be no reason to give up on understanding how consumers think. And when people don’t buy, the answer may be: be patient, they’re getting there. Sometimes the heaviest researchers are those who reward you with the greatest lifetime value when all is said and done. Very special snowflakes indeed.
Read Part 13: Steer Clear of Overconfidence to Win at PPC